| Item | Average inflation per year, 2002-2004 | Data |
|---|---|---|
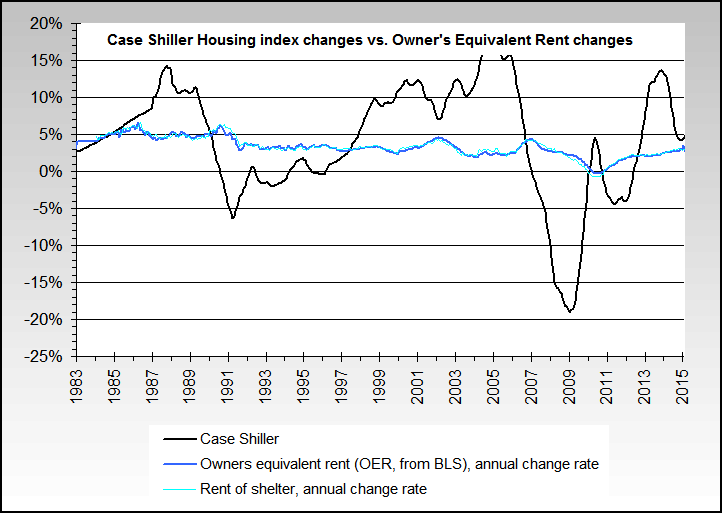
| Housing | 14%+ | Median US house 2002 = $158,000. Mid 2005 $240,000. (source = US Census and OFHEO data)(see hedonics in the glossary) |
| Food | 7%+ (52% - 2002-9 per the CRB Food index) |
The agricultural price index (all farm products) has moved from 95 to 140, about 47% per here Also ask yourself how much more you're paying for dining out (for the exact same meal) than a few years ago.. 7/2007: 23% food price in last 18 months per the IMF |
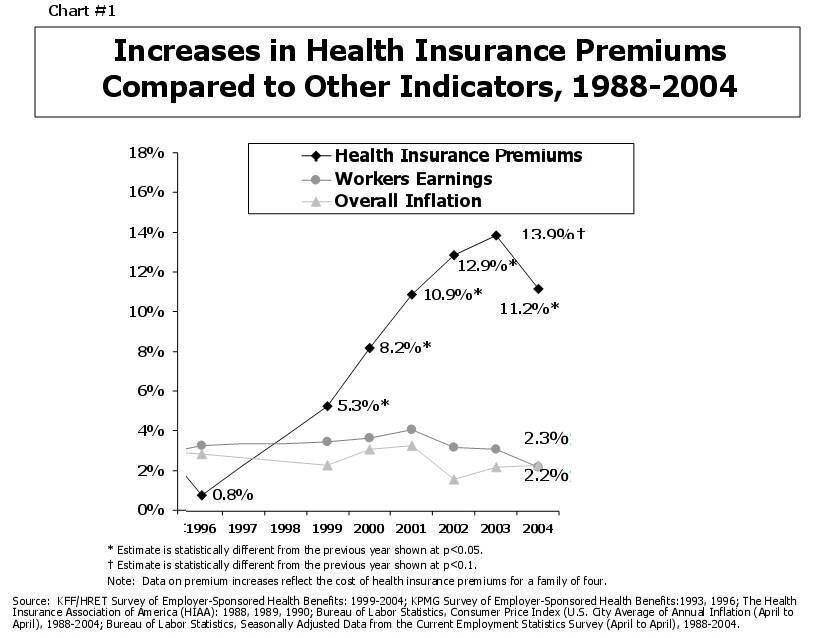
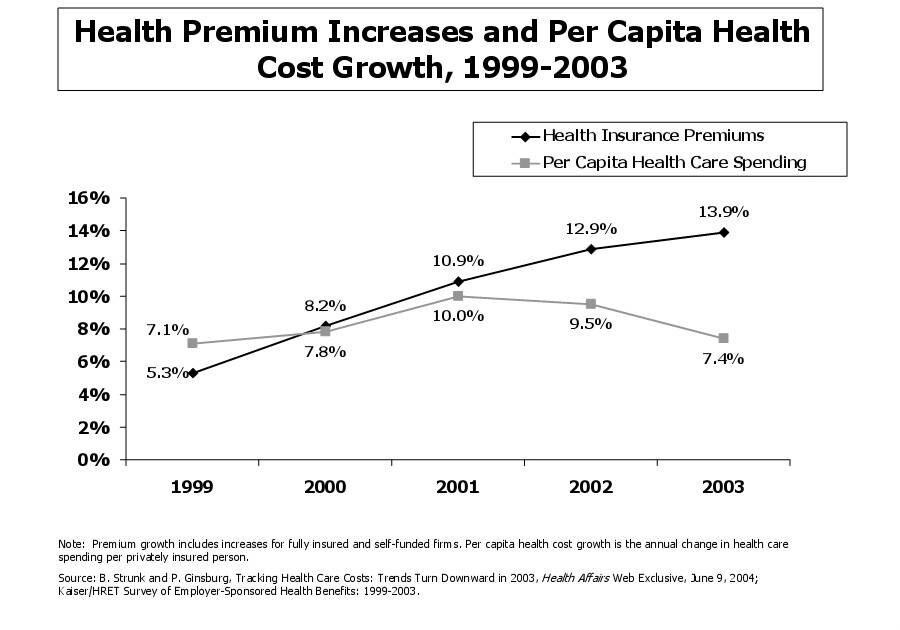
| Health care | 9.5% | "Total national health expenditures increased by 7.7 percent in 2003...In 2004, employer health insurance premiums increased by 11.2 percent" (source). The Health Care Index is also up over 80% in the two year period ending in August of 2005. Health insurance costs doubled since 2000. See a health care popup chart here, click here for regular link. See a premiums/benefits popup chart here, click here for regular link. An early 2007 Washington Post article here. A mid 2007 article about very large price increases here and here. 9% price increases for health insurance in 2009 Survey: Health insurance costs surged in 2011 Health-Benefit Costs Rise Most in Six Years 9% price increases for health insurance in 2011, 3% in 2010 due to lower demand from recessionary effects As of early 2012, the BLS index of health insurance is up over 13% since last year Assuming the Affordable Care Act ('Obamacare') goes into effect as is, we estimate overall medical costs to increase an additional 1.5%/year minimum. |
| Education | 6%+ | College education has gone up 5-6%+ per year since mid '90s per here and here. 2005 - Increases in tuition, fees, room and board by the schools ranged from 4.3 percent at Ithaca, N.Y.-based Cornell University, which will charge $41,767, to 5.5 percent at Yale University…, which will cost $41,000… Harvard… raised its rate by 4.5 percent to $41,675. “The University of Colorado’s board of regents approved a 28 percent tuition increase for the 2006 fiscal year", the Denver Post reported. As of 2009, education costs are still increasing well above the reported CPI rate. Per BLS and BCES data, 4 year university costs have increased at 7.7% per year. Late 2009, University of California tuition prices increase 42%. Coast-to-coast double-digit college tuition hikes On average, tuition tends to increase about 8% per year. An 8% college inflation rate means that the cost of college doubles every nine years. "Public four-year colleges charge, on average, $7,605 per year in tuition and fees for in-state students. The average surcharge for full-time out-of-state students at these institutions is $11,990." "Private nonprofit four-year colleges charge, on average, $27,293 per year in tuition and fees."Source Even the BLS itself shows that the education segment costs have risen greatly - well over 10x since 1978. |
| Gasoline | 20%+ | Wholesale unleaded gas without any taxes in 2002 was about $.75 per gallon average. Late 2004 - $1.40. Mid 2009 - $2.80. |
| Taxes | -1% | Tax freedom day remained about the same per the Tax Foundation. As of the Obama administration, taxes & fees, etc. are slated to rise significantly. |
| New Cars | 2.3% | Per Edmunds's data, the increase from 2003-2004 was 2.3%. Overall, new cars have been only slightly inflating on average for many years. |
| "Other" | -10%+ | Many consumer items that are infrequent purchases like computers, clothing, DVD players & microwaves have gone down in price. But one doesn't buy them every week or month, and they are not essentials like food, housing, etc. On the other hand, postal rates and UPS prices are up about 5% per year (2009 UPS rate increase averages 4.9%). |
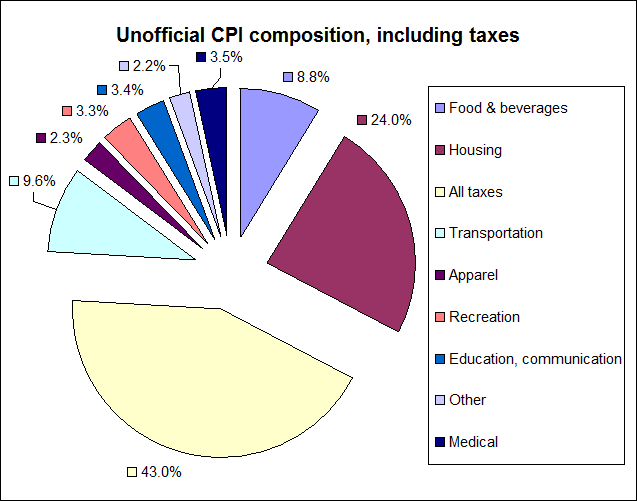
| What is this on the inflation "core rate" which excludes food and energy too? Does someone seriously think that a broad price index should not include daily use items like food and energy? We fail to see any purpose for the concentration on it other than political and similar ones. If the concern is truly erratic changes in food and energy, just use a simple moving average. | ||
![]()
| Amount, cumulative | As of date | Source data |
|---|---|---|
| +1.0% | 1982 | Homeowner's equivalent rent, BLS |
| +1.5% | 1993 | Hedonics, BLS |
| +2.5% | 1997 | Boskin Commission Report results |
| +3.5% | 2001 | Hedonics, BLS |
| +4.0% | 2004 | Hedonics, BLS |
| +4.5% | 2005 | Hedonics, BLS |
| +5.0%-5.8% | 2006 and on | Hedonics, BLS |
![]()
.jpg)