Intervention possibilities & probabilities
We've charted below a number of indexes and commodities along with most of the major 'hot money' Federal Reserve and U.S. Treasury tools that can be used to control or manipulate the various markets, indexes, etc.
The lines representing those tools are based on the tool's individual annual rates of change. They have then been processed to identify and isolate high rates of change, and then adjusted again in order to scale them in a similar manner with the other tools. The three major tools (POMOs, TOMOs and TIOs) are on every chart so that you can make the call on which (if any) of the tools are possibly being used to affect a market in which you have interest.
Custodials and securities lending are also on some of the charts for those who track them. Lastly, our crisis probability indicator is also plotted for reference.
Data sources: POMO, H41 (Repurchase agreements), TOMO, TIO, Custodials (under 'off-balance-sheet items'), Crisis and SecLend (our full ESF work is proprietary but one source is here).
The basic algorithms are range limited annual rates of change - that are then filtered with a trigger point. The trigger point that allows some line to be drawn on the chart changes depending on the item - in other words, TIOs have a different trigger point than POMOs, etc.
9/24/2007 change: Due to a change in how TIO submit/accept numbers are presented, our algorithm has changed.
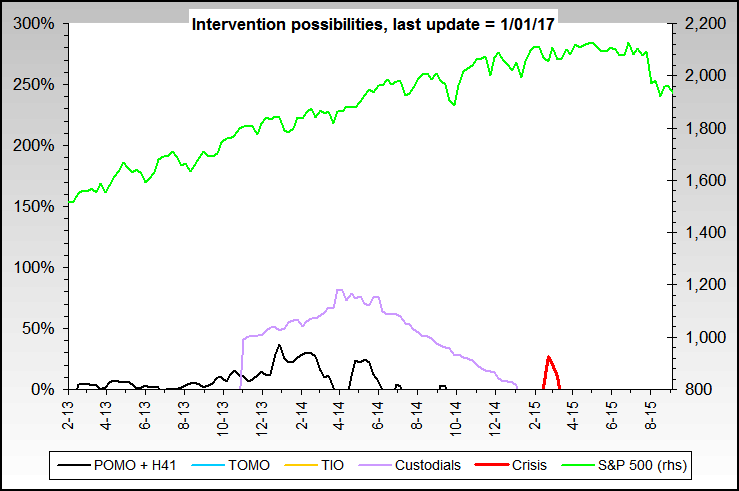
S&P 500
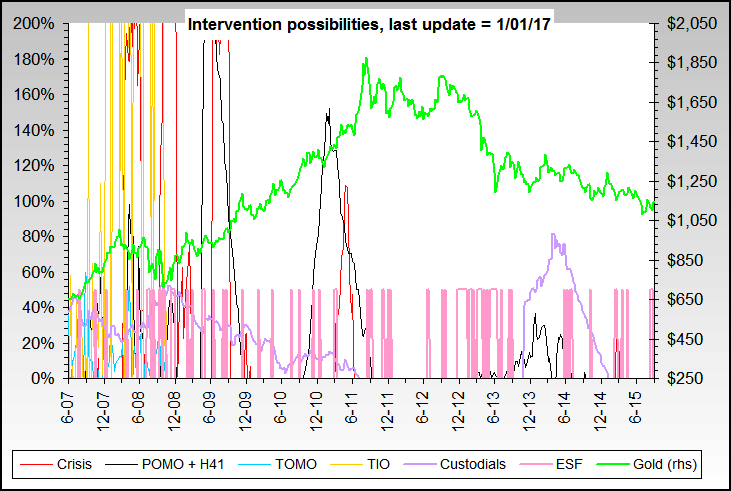
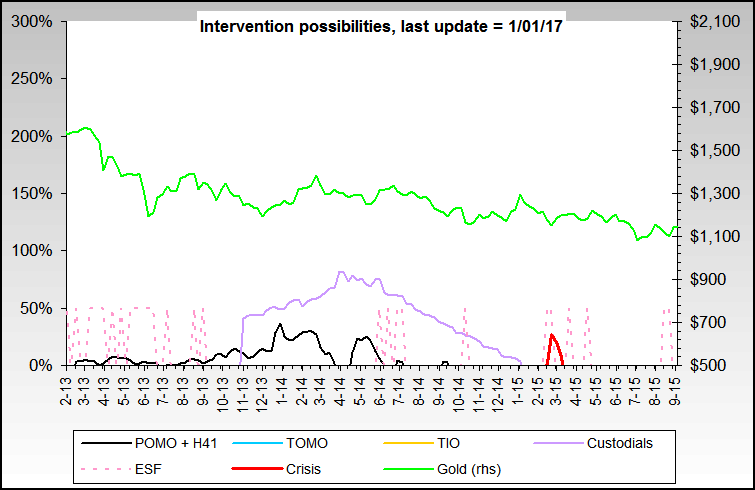
Gold
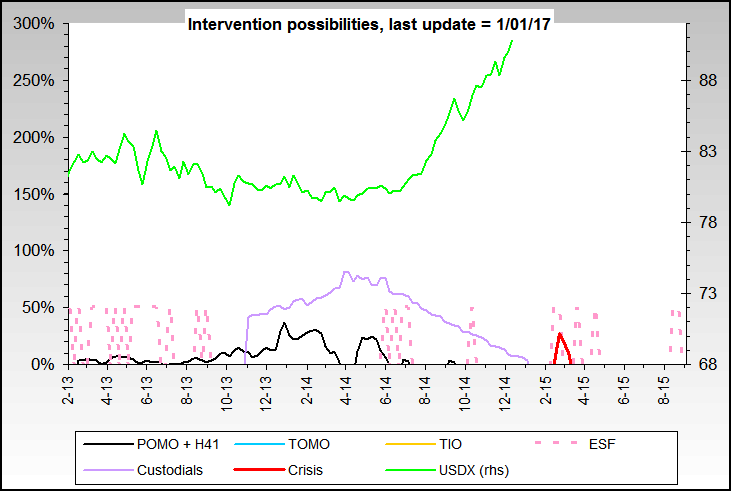
Dollar index (USDX)
10 year Treasury
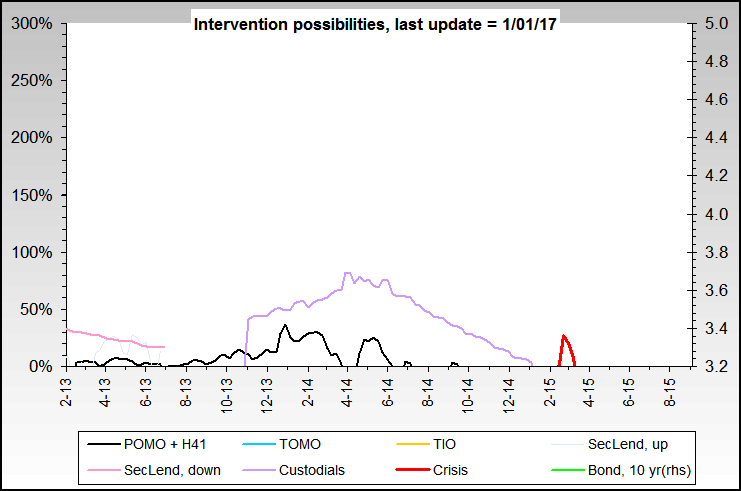
Oil
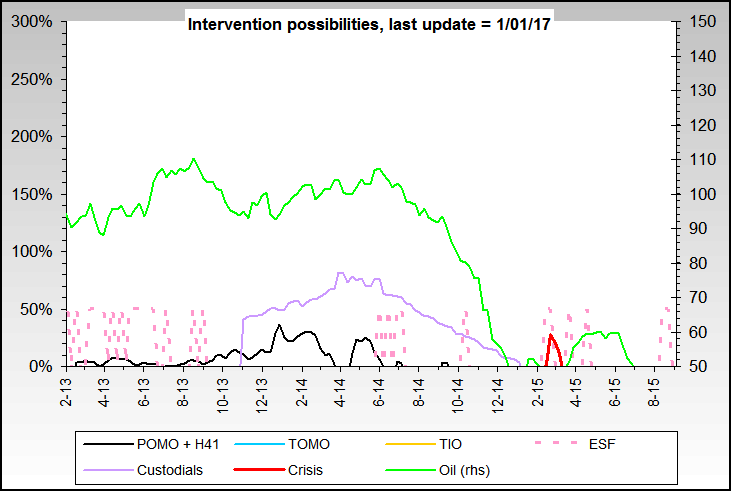
Long term, with gold