Gold price manipulation proof
By bart
July 25, 2008 (slightly revised from original January 2007 article)
7/22/2010 - Mea culpa and our sincere apologies, the ECB changed a valuation date & methodology and we missed it. Charts have been corrected - there was no change in ECB gold holdings.
There's really not much to say, since the raw charted data is so obvious, but there are some facts.
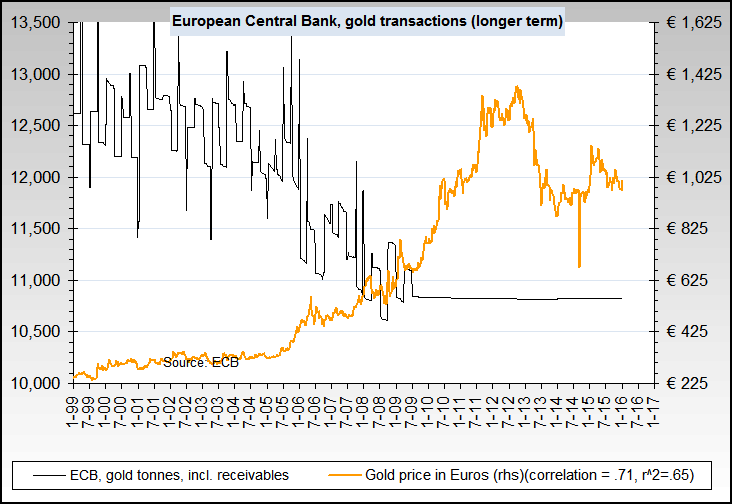
- The correlation between the European Central Bank's gold purchase and sale activity and the gold price in Euros is -.71. That means that close to 71% of the gold price changes since 1999 can be explained by ECB actions alone.
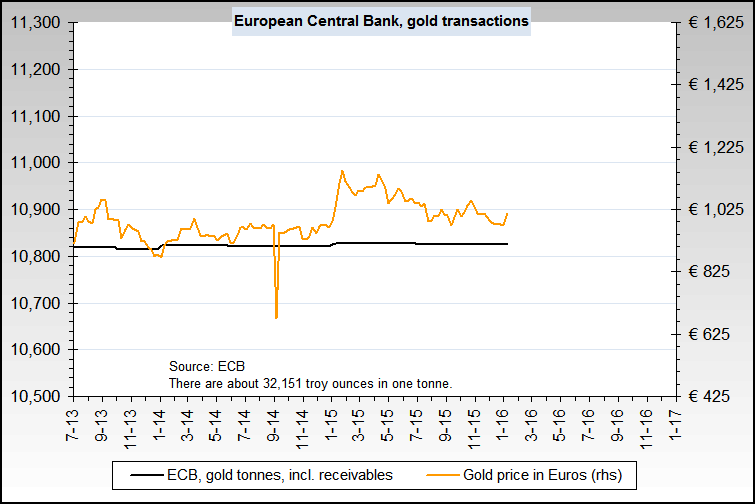
- The left hand scale on both charts is in metric tonnes. One metric tonne is about 32,150 troy ounces of gold.
- As just one example of the very large size of ECB gold operations, during the gold price increase from early April 2006 to the peak in mid May 2006, the ECB sold 1,000 metric tonnes of gold. Almost half of the sales occurred in the last week. That translates to about 31 million troy ounces. During the fall from mid May 2006 to a bottom in June 2006, they bought back 1,875 metric tonnes, which is approximately 60 million troy ounces.
- Just for reference, the total supply of gold per the World Gold Council in 2005 was 3,953 metric tonnes or about 127 million troy ounces.
- The total gold price increase from about 325 to 500 Euros caused the average ECB gold inventory to drop about 1200 metric tonnes or about 39 million troy ounces.
- The quantity of gold trading by the ECB dwarfs the total 500 metric tonne sale limit of the Washington Agreement.
- For those who might point out that futures trading quantities are far larger, that's true. But not only are they only paper trades and physical gold is seldom delivered, but also there are thousands of different traders and none consistently trade in quantities similar to the ECB.
- The data is published by the ECB anywhere from 1-2 weeks behind the events, so it's not useful for trading. Here is the weekly data link for 2008.
- Some might prefer to look at the data as evidence of control, as opposed to manipulation.
- The huge majority of the ECB trades are in the "receivables", or "paper gold" area. For proof, simply repeat the search in the first point above and drop the word receivables.
The gold trading record of the ECB, since 1999
The close-up gold trading record of the ECB
"So the question is, having very consciously and purposely tried to break the bubble and upset the markets in order to sort of break the cocoon of capital gains speculation, we are now in a position—having done that and in a sense succeeded perhaps more than we had intended—to try to restore some degree of confidence in the System."
-- Alan Greenspan, Chairman of the Federal Reserve.
Source: Federal Open Market Committee (FOMC) meeting minutes from March 22, 1994 (page 41)(note that the source is a large pdf file).
"Central banks stand ready to lease gold in increasing quantities should the price rise."
-- Alan Greenspan, testimony to Congress on July 24, 1998
Gold Market Lending, an excellent treatment of many issues in this area from Blanchard and Company, Inc.
Lastly, we do not mean in any way to imply that the ECB will win on the longer term with its control or manipulation of gold. Central banks, etc. did not win during the last gold bull market in the 1970s. Our primary intention is to show that control or manipulation exists, and that it should be taken into account for both traders and investors.
Note for researchers and the curious:
The ECB data for gold and receivables purchases and sales is both here and is also linked in the first bullet above. It brings up a search page in the ECB's database. Just check/select the first option ( the key is "ILM.W.U2.C.A010.Z5.Z0Z" as of late July 2008), and then click the "show selected data" button just above it. That will bring up the actual weekly data going back to 1999, which is in millions of Euros.
The only adjustments we've made to that raw data is to convert the values into troy ounces using the Euro gold price on the quarter ending date (the ECB only revalues its gold quarterly), and then converting to metric tonnes using a factor of 32,151 troy ounces per metric tonne. There are undoubtedly some minor discrepancies due to the conversion process, but not enough to materially change the results.
The R-squared correlation (Pearson) is .64.
Also, Empirically observed covariation is a necessary but not sufficient condition for causality.
